
A culture and sensitivity report, as I described in my last blog post, can come back as a column of Rs: resistant across all tested antibiotics. This tells us that a bacterium is resistant, but not why. It also does not name the gene responsible. To find those answers, researchers turn to the bacterium’s DNA.
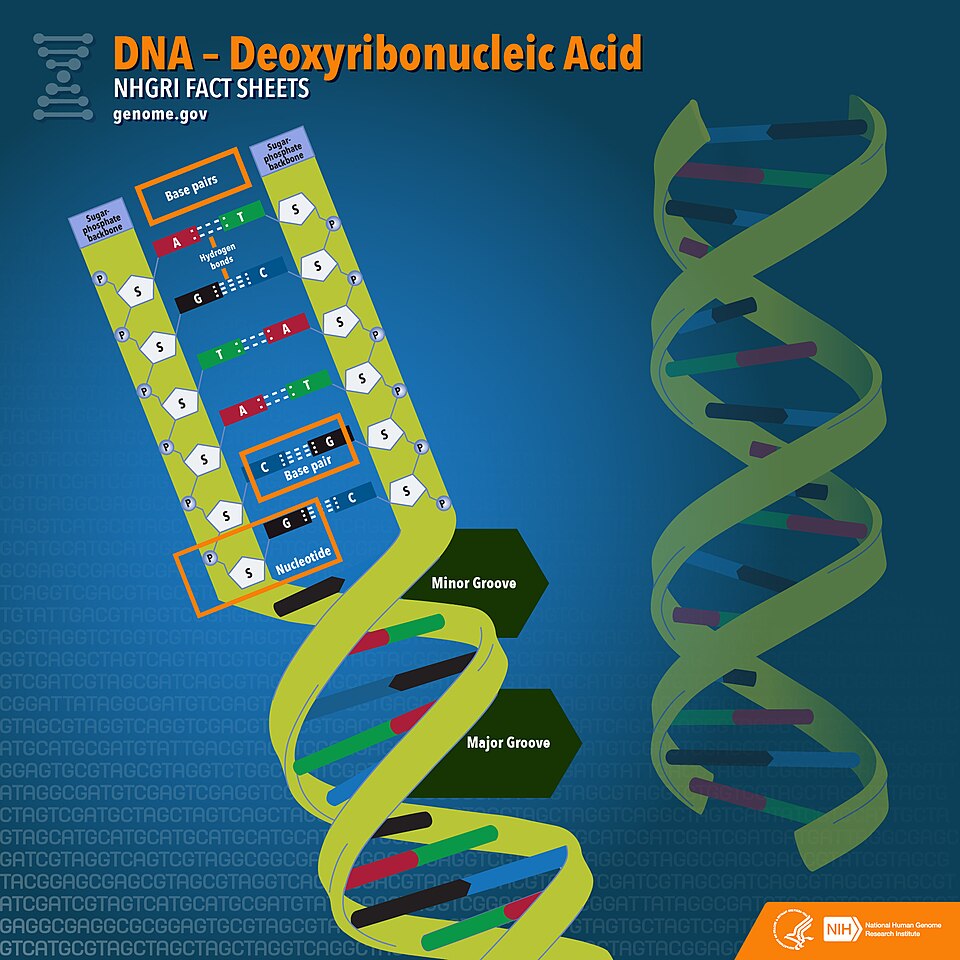
A bacterium’s DNA is a long sequence of four chemical letters – A, T, G and C – known as nucleotides. Just four letters. Arranged in a string millions of characters long, the order of these nucleotides encodes everything the bacterium is: how it grows, what it resists, how it survives. To decode that order, scientists utilize a process called sequencing – decoding the bacterium’s entire genetic instruction set into text we can work with.
So now we have the text. Millions of letters. Somewhere in there are the genes responsible for that column of Rs. One way to find them using computer programs is to compare against a collection of known resistance genes. That collection has its own origin story.
Back to the origin
For most of the genes in this collection, discovery began on a lab bench. A bacterium survived an antibiotic it should not have survived. Researchers identified the specific gene responsible through laboratory experiments – isolating the gene from the bacterium’s DNA, inserting it into a susceptible bacterium and confirming that this gene alone was enough to confer resistance. Once validated, the gene’s sequence is deposited into a public record. blaNDM-1, for instance—a gene in the family behind the Nevada case from my last post—was first identified this way in 2008.
Over decades, thousands of such discoveries accumulated into curated databases—a collection of every resistance gene scientists have ever identified and confirmed. With these databases, that comparison of a bacterium’s genetic instruction set to identify the genes responsible for its resistance can now begin.
Searching the database
Searching the database implies comparing an unknown DNA sequence against every entry in that database, looking for regions of similarity. Each comparison within that search works by alignment—lining up two sequences, letter by letter and measuring how well they correspond.
Though the starting point is always DNA, the comparison itself can happen at different levels. A nucleotide-to-nucleotide search compares the raw genetic letters—the A, T, G and C—directly. Yet DNA letters do more than sit in a sequence; they carry instructions for building proteins. Proteins are the molecular machinery that perform functions inside the cell, such as breaking down antibiotics. A protein-level search compares these functional products rather than the underlying letters. This matters because some changes to the DNA are silent – they do not alter the protein the gene builds. Two genes might look different at the letter level but produce the same resistance protein. A letter-level search could miss the connection between both genes. A protein-level search would detect it.
Not always an exact match
If these genes are already in the database, we might expect to find exact matches and sometimes we do. Often, though, the gene in a new bacterium is not identical to the version in the database, even though it still performs the same function.
Bacteria reproduce by dividing, one cell splitting into two, each needing its own complete copy of the DNA. Every time that copying happens, small errors can creep in – a letter swapped, a short stretch altered. Scientists call these changes mutations, and over many generations, they accumulate. A gene that still confers the same resistance, in the same way, may no longer look letter-for-letter identical to the database entry.
This is why the database search does not require a perfect copy. Instead, it allows for a degree of variation and uses thresholds—defined cut-offs—to determine how much change is acceptable. When you compare two sequences and 92 percent of the letters line up, is that the same gene? What about 85 percent? 70? Thresholds are the lines researchers draw. They measure how many letters match, how much of the gene in the database the match spans and how likely a match this strong would occur by chance. Together, these thresholds determine whether a result is a confirmed detection, a partial match warranting closer inspection or noise.
There is a limit, however, to how much variation direct comparison can accommodate. A gene can change enough over time that even flexible thresholds no longer detect it, even though the protein it builds still functions and still confers resistance. In my next blog post, I will introduce a method designed for exactly this kind of challenge.
Image credit: National Human Genome Research Institute (NHGRI) from Bethesda, MD, USA, CC BY 2.0, via Wikimedia Commons


